Classification
监督学习任务(分类) 1 2 3 4 5 6 7 8 9 10 11 12 13 14 15 16 17 18 19 20 21 22 23 24 25 26 27 28 from __future__ import division, print_function, unicode_literalsimport numpy as npimport osnp.random.seed(42 ) %matplotlib inline import matplotlibimport matplotlib.pyplot as pltplt.rcParams['axes.labelsize' ] = 14 plt.rcParams['xtick.labelsize' ] = 12 plt.rcParams['ytick.labelsize' ] = 12 PROJECT_ROOT_DIR = "." CHAPTER_ID = "classification" def save_fig (fig_id, tight_layout=True ): path = os.path.join(PROJECT_ROOT_DIR, "images" , CHAPTER_ID, fig_id + ".png" ) print("Saving figure" , fig_id) if tight_layout: plt.tight_layout() plt.savefig(path, format ='png' , dpi=300 )
MNIST 1 2 3 from sklearn.datasets import fetch_openmlmnist = fetch_openml('mnist_784' ) mnist
{'data': array([[0., 0., 0., ..., 0., 0., 0.],
[0., 0., 0., ..., 0., 0., 0.],
[0., 0., 0., ..., 0., 0., 0.],
...,
[0., 0., 0., ..., 0., 0., 0.],
[0., 0., 0., ..., 0., 0., 0.],
[0., 0., 0., ..., 0., 0., 0.]]),
'target': array(['5', '0', '4', ..., '4', '5', '6'], dtype=object),
'frame': None,
'categories': {},1 2 X, y = mnist["data" ], mnist["target" ] X.shape
(70000, 784)(70000,)7841 2 3 4 5 6 7 8 9 10 11 12 13 %matplotlib inline import matplotlibimport matplotlib.pyplot as pltsome_digit = X[36000 ] some_digit_image = some_digit.reshape(28 , 28 ) plt.imshow(some_digit_image, cmap = matplotlib.cm.binary, interpolation="nearest" ) plt.axis("off" ) save_fig("some_digit_plot" ) plt.show()
Saving figure some_digit_plot
1 2 3 4 5 def plot_digit (data ): image = data.reshape(28 , 28 ) plt.imshow(image, cmap = matplotlib.cm.binary, interpolation="nearest" ) plt.axis("off" )
1 2 3 4 5 6 7 8 9 10 11 12 13 14 15 def plot_digits (instances, images_per_row=10 , **options ): size = 28 images_per_row = min (len (instances), images_per_row) images = [instance.reshape(size,size) for instance in instances] n_rows = (len (instances) - 1 ) // images_per_row + 1 row_images = [] n_empty = n_rows * images_per_row - len (instances) images.append(np.zeros((size, size * n_empty))) for row in range (n_rows): rimages = images[row * images_per_row : (row + 1 ) * images_per_row] row_images.append(np.concatenate(rimages, axis=1 )) image = np.concatenate(row_images, axis=0 ) plt.imshow(image, cmap = matplotlib.cm.binary, **options) plt.axis("off" )
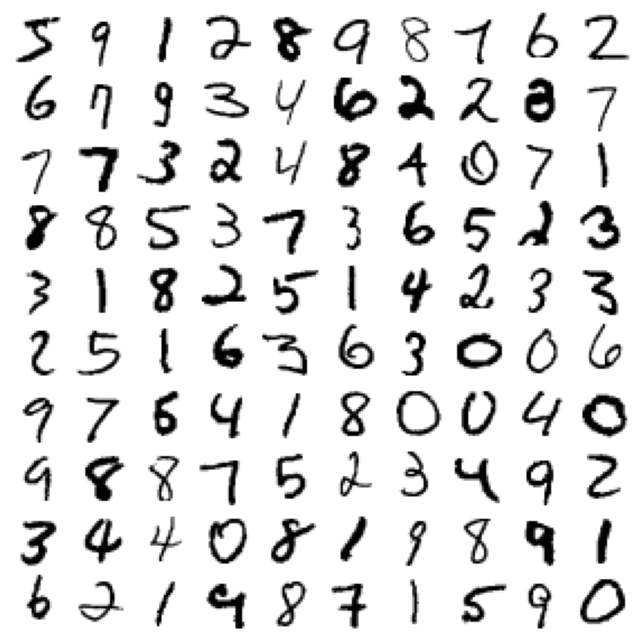
1 2 3 4 5 plt.figure(figsize=(9 ,9 )) example_images = np.r_[X[:12000 :600 ], X[13000 :30600 :600 ], X[30600 :60000 :590 ]] plot_digits(example_images, images_per_row=10 ) save_fig("more_digits_plot" ) plt.show()
Saving figure more_digits_plot
'9'1 2 X_train, X_test, y_train, y_test = X[:60000 ], X[60000 :], y[:60000 ], y[60000 :]
1 2 3 4 import numpy as npshuffle_index = np.random.permutation(60000 ) X_train, y_train = X_train[shuffle_index], y_train[shuffle_index] print(X_train.shape)
(60000, 784)Binary classifier二分类 1 2 3 4 5 y_train = y_train.astype(np.int8) print(y_train_5) y_train_5 = (y_train == 5 ) y_test_5 = (y_test == 5 )
[False False True ... False False False]1 2 3 4 from sklearn.linear_model import SGDClassifiersgd_clf = SGDClassifier(random_state=42 ) sgd_clf.fit(X_train, y_train_5)
SGDClassifier(random_state=42)1 sgd_clf.predict([some_digit])
array([False])1 2 3 4 5 from sklearn.model_selection import cross_val_scorecross_val_score(sgd_clf, X_train, y_train_5, cv=3 , scoring="accuracy" )
array([0.9334, 0.9644, 0.9568])1 2 3 4 5 6 7 8 9 10 11 12 13 14 15 16 from sklearn.model_selection import StratifiedKFoldfrom sklearn.base import cloneskfolds = StratifiedKFold(n_splits=3 , random_state=42 ) for train_index, test_index in skfolds.split(X_train, y_train_5): clone_clf = clone(sgd_clf) X_train_folds = X_train[train_index] y_train_folds = (y_train_5[train_index]) X_test_fold = X_train[test_index] y_test_fold = (y_train_5[test_index]) clone_clf.fit(X_train_folds, y_train_folds) y_pred = clone_clf.predict(X_test_fold) n_correct = sum (y_pred == y_test_fold) print(n_correct / len (y_pred))
D:\Anaconda3\envs\learn\lib\site-packages\sklearn\model_selection\_split.py:297: FutureWarning: Setting a random_state has no effect since shuffle is False. This will raise an error in 0.24. You should leave random_state to its default (None), or set shuffle=True.
FutureWarning
0.9334
0.9644
0.95681 2 3 4 5 6 from sklearn.base import BaseEstimatorclass Never5Classifier (BaseEstimator ): def fit (self, X, y=None ): pass def predict (self, X ): return np.zeros((len (X), 1 ), dtype=bool )
1 2 3 4 never_5_clf = Never5Classifier() cross_val_score(never_5_clf, X_train, y_train_5, cv=3 , scoring="accuracy" )
array([0.90855, 0.9093 , 0.9111 ])1 2 3 from sklearn.model_selection import cross_val_predicty_train_pred = cross_val_predict(sgd_clf, X_train, y_train_5, cv=3 )
1 2 3 from sklearn.metrics import confusion_matrixconfusion_matrix(y_train_5, y_train_pred)
array([[53124, 1455],
[ 949, 4472]], dtype=int64)1 2 3 4 5 6 7 8 y_train_perfect_predictions = y_train_5 '''混淆矩阵中的行表示实际类别, 列表示预测类别。 本例中第一行 表示所有“非5”(负类) 的图片中: 53065张被正确地分为“非5”类别 (真负类) , 1455张被错误地分类成了“5”(假正类) ; 第二行表示 所有“5”(正类) 的图片中: 949张被错误地分为“非5”类别(假负 类) , 4472张被正确地分在了“5”这一类别(真正类) 。 一个完美的 分类器只有真正类和真负类, 所以它的混淆矩阵只会在其对角线(左 上到右下) 上有非零值:'''
1 confusion_matrix(y_train_5, y_train_perfect_predictions)
array([[54579, 0],
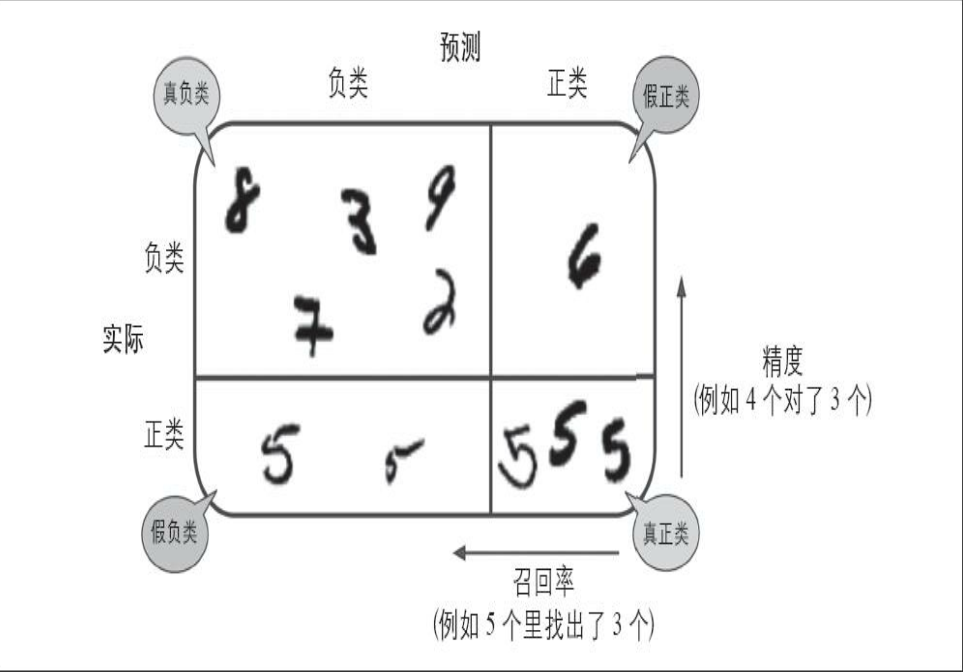
[ 0, 5421]], dtype=int64)正类预测的准确度也可称为分类器的精度
TP是真正类的数量, FP是假正类的数量。
精度通常与另一个指标一起使用,这个指标就是召回率(recall),也称为灵敏度(sensitivity)或者真正类率(TPR):它是分类器正确检测到的正类实例的比率
FN是假负类的数量。
图解混淆矩阵
精度和召回率 1 2 3 4 5 from sklearn.metrics import precision_score, recall_scoreprecision_score(y_train_5, y_train_pred)
0.7545132444744391 recall_score(y_train_5, y_train_pred)
0.8249400479616307因此我们可以很方便地将精度和召回率组合成一个单一的指标,称为F1分数。 当你需要一个简单的方法来比较两种分类器时, 这是个非常不错的指标。 F1分数是精度和召回率的谐波平均值 。 正常的平均值平等对待所有的值, 而谐波平均值会给予较低的值更高的权重。 因此, 只有当召回率和精度都很高时, 分类器才能得到较高的F1分数
F1分数
1 2 from sklearn.metrics import f1_scoref1_score(y_train_5, y_train_pred)
0.78815650334860781 4472 / (4472 + (949 + 1455 )/2 )
0.7881565033486078精度/召回率权衡 Scikit-Learn不允许直接设置阈值,但是可以访问它用于预测的决策分数。不是调用分类器的predict()方法,而是调用decision_function()方法,这个方法返回每个实例的分数,然后就可以根据这些分数,使用任意阈值进行预测了:
1 2 y_scores = sgd_clf.decision_function([some_digit]) y_scores
array([ 161855.74572176])1 2 threshold = 0 y_some_digit_pred = (y_scores > threshold)
array([ True], dtype=bool)
1 2 3 threshold = 200000 y_some_digit_pred = (y_scores > threshold) y_some_digit_pred
array([False], dtype=bool)这证明了提高阈值确实可以降低召回率。 这张图确实是5, 当阈值为0时, 分类器可以检测到该图, 但是当阈值提高到200000时, 就错过了这张图。
那么要如何决定使用什么阈值呢? 首先, 使用cross_val_predict() 函数获取训练集中所有实例的分数, 但是这次需要它返回的是决策分数而不是预测结果:1 2 y_scores = cross_val_predict(sgd_clf, X_train, y_train_5, cv=3 , method="decision_function" )
Note: there is an issue introduced in Scikit-Learn 0.19.0 where the result of cross_val_predict() is incorrect in the binary classification case when using method="decision_function", as in the code above. The resulting array has an extra first dimension full of 0s. We need to add this small hack for now to work around this issue:
(60000, 2)1 2 3 if y_scores.ndim == 2 : y_scores = y_scores[:, 1 ]
有了这些分数, 可以使用precision_recall_curve() 函数来计算
1 2 3 from sklearn.metrics import precision_recall_curveprecisions, recalls, thresholds = precision_recall_curve(y_train_5, y_scores)
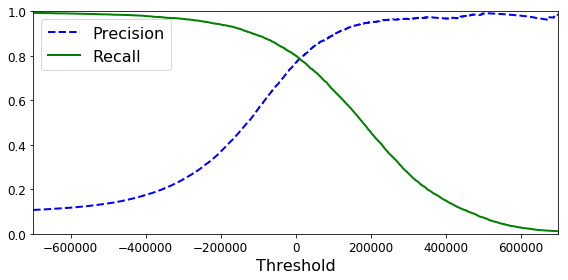
最后, 使用Matplotlib绘制精度和召回率相对于阈值的函数图
1 2 3 4 5 6 7 8 9 10 11 12 def plot_precision_recall_vs_threshold (precisions, recalls, thresholds ): plt.plot(thresholds, precisions[:-1 ], "b--" , label="Precision" , linewidth=2 ) plt.plot(thresholds, recalls[:-1 ], "g-" , label="Recall" , linewidth=2 ) plt.xlabel("Threshold" , fontsize=16 ) plt.legend(loc="upper left" , fontsize=16 ) plt.ylim([0 , 1 ]) plt.figure(figsize=(8 , 4 )) plot_precision_recall_vs_threshold(precisions, recalls, thresholds) plt.xlim([-700000 , 700000 ]) save_fig("precision_recall_vs_threshold_plot" ) plt.show()
Saving figure precision_recall_vs_threshold_plot
1 (y_train_pred == (y_scores > 0 )).all ()
True1 y_train_pred_90 = (y_scores > 70000 )
1 precision_score(y_train_5, y_train_pred_90)
0.865920511649154841 recall_score(y_train_5, y_train_pred_90)
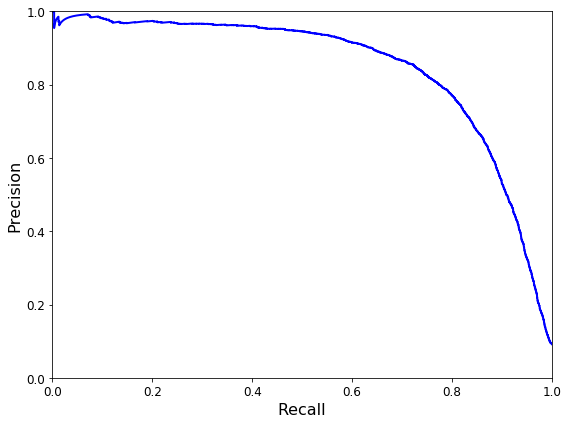
0.699317469101641721 2 3 4 5 6 7 8 9 10 def plot_precision_vs_recall (precisions, recalls ): plt.plot(recalls, precisions, "b-" , linewidth=2 ) plt.xlabel("Recall" , fontsize=16 ) plt.ylabel("Precision" , fontsize=16 ) plt.axis([0 , 1 , 0 , 1 ]) plt.figure(figsize=(8 , 6 )) plot_precision_vs_recall(precisions, recalls) save_fig("precision_vs_recall_plot" ) plt.show()
Saving figure precision_vs_recall_plot
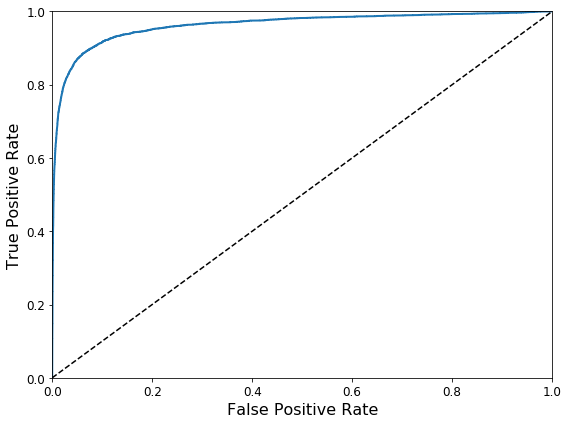
ROC 曲线 ROC叫受试者工作特征曲线。它与精度/召回率曲线非常相似,但绘制的不FPR)。 FPR是被错误分为正类的负类实例比率。它等于1减去真负类率(TNR),后者是被正确分类为负类的负类实例比率,也称为特异度。因此, ROC曲线绘制的是灵敏度和(1-特异度)的关系。
要绘制ROC曲线,首先需要使用roc_curve()函数计算多种阈值的TPR和FPR:1 2 from sklearn.metrics import roc_curvefpr, tpr, thresholds = roc_curve(y_train_5, y_scores)
然后,使用Matplotlib绘制FPR对TPR的曲线。1 2 3 4 5 6 7 8 9 10 11 def plot_roc_curve (fpr, tpr, label=None ): plt.plot(fpr, tpr, linewidth=2 , label=label) plt.plot([0 , 1 ], [0 , 1 ], 'k--' ) plt.axis([0 , 1 , 0 , 1 ]) plt.xlabel('False Positive Rate' , fontsize=16 ) plt.ylabel('True Positive Rate' , fontsize=16 ) plt.figure(figsize=(8 , 6 )) plot_roc_curve(fpr, tpr) save_fig("roc_curve_plot" ) plt.show()
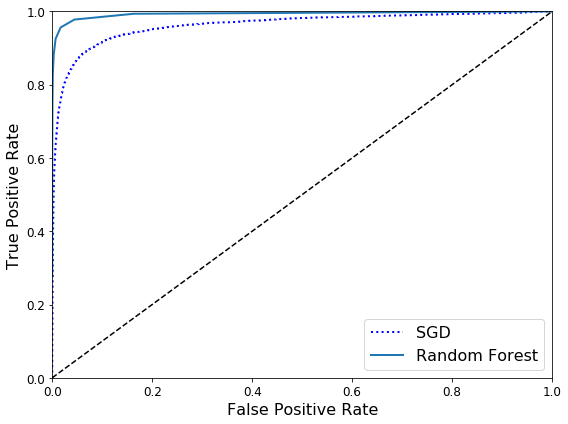
Saving figure roc_curve_plot召回率(TPR) 越高, 分类器产生的假正类(FPR) 就越多。 虚线表示纯随机分类器的ROC曲线;一个优秀的分类器应该离这条线越远越好(向左上角) 。
有一种比较分类器的方法是测量曲线下面积(AUC) 。 完美的分类器的ROC AUC等于1, 而纯随机分类器的ROC AUC等于0.5。Scikit-Learn提供计算ROC AUC的函数:
1 2 from sklearn.metrics import roc_auc_scoreroc_auc_score(y_train_5, y_scores)
0.96244965559671547由于ROC曲线与精度/召回率(或PR) 曲线非常相似,有时候我们会选择使用哪种曲线,有一个经验法则是, 当正类非常少见或者你更关注假正类而不是假负类时, 你应该选择PR曲线, 反之则是ROC曲线。PR曲线可以暗示分类器还有改进的空间(曲线更接近右上角)。
下面训练一个RandomForestClassifier分类器,并比较它和SGDClassifier分类器的ROC曲线和ROC AUC分数。
1 2 3 4 from sklearn.ensemble import RandomForestClassifierforest_clf = RandomForestClassifier(random_state=42 ) y_probas_forest = cross_val_predict(forest_clf, X_train, y_train_5, cv=3 , method="predict_proba" )
1 2 y_scores_forest = y_probas_forest[:, 1 ] fpr_forest, tpr_forest, thresholds_forest = roc_curve(y_train_5,y_scores_forest)
1 2 3 4 5 6 plt.figure(figsize=(8 , 6 )) plt.plot(fpr, tpr, "b:" , linewidth=2 , label="SGD" ) plot_roc_curve(fpr_forest, tpr_forest, "Random Forest" ) plt.legend(loc="lower right" , fontsize=16 ) save_fig("roc_curve_comparison_plot" ) plt.show()
Saving figure roc_curve_comparison_plot
1 roc_auc_score(y_train_5, y_scores_forest)
0.993124336600382911 2 y_train_pred_forest = cross_val_predict(forest_clf, X_train, y_train_5, cv=3 ) precision_score(y_train_5, y_train_pred_forest)
0.985297344744349381 recall_score(y_train_5, y_train_pred_forest)
0.82826046854823832
再测一测精度和召回率的分数: 98.5%的精度和82.8%的召回率, 也还不错!Multiclass classification多类别分类器 二元分类器在两个类别中区分,而多类别分类器(也称为多项分类器)可以区分两个以上的类别。
Scikit-Learn可以检测到你尝试使用二元分类算法进行多类别分类任务,它会自动运行OvA(SVM分类器除外,它会使用OvO)。我们用SGDClassifier试试:
1 2 sgd_clf.fit(X_train, y_train) sgd_clf.predict([some_digit])
array([ 5.])可以调用decision_function( ) 方法,Scikit-Learns实际上训练了10个二元分类器,获得它们对图片的决策分数, 然后选择了分数最高的类别。
1 2 some_digit_scores = sgd_clf.decision_function([some_digit]) some_digit_scores
array([[-311402.62954431, -363517.28355739, -446449.5306454 ,
-183226.61023518, -414337.15339485, 161855.74572176,
-452576.39616343, -471957.14962573, -518542.33997148,
-536774.63961222]])1 np.argmax(some_digit_scores)
5array([ 0., 1., 2., 3., 4., 5., 6., 7., 8., 9.])5.01 2 3 4 from sklearn.multiclass import OneVsOneClassifierovo_clf = OneVsOneClassifier(SGDClassifier(random_state=42 )) ovo_clf.fit(X_train, y_train) ovo_clf.predict([some_digit])
array([ 5.])1 len (ovo_clf.estimators_)
451 2 forest_clf.fit(X_train, y_train) forest_clf.predict([some_digit])
array([ 5.])1 forest_clf.predict_proba([some_digit])
array([[ 0.1, 0. , 0. , 0.1, 0. , 0.8, 0. , 0. , 0. , 0. ]])1 cross_val_score(sgd_clf, X_train, y_train, cv=3 , scoring="accuracy" )
array([ 0.84063187, 0.84899245, 0.86652998])1 2 3 4 from sklearn.preprocessing import StandardScalerscaler = StandardScaler() X_train_scaled = scaler.fit_transform(X_train.astype(np.float64)) cross_val_score(sgd_clf, X_train_scaled, y_train, cv=3 , scoring="accuracy" )
array([ 0.91011798, 0.90874544, 0.906636 ])错误分析 一般机器学习项目包含:探索数据准备的选项, 尝试多个模型, 列出最佳模型并用GridSearchCV对其超参数进行微调, 尽可能自动化。假设当前已经找到了一个由潜力的模型,现在想进一步微调参数。首先, 看看混淆矩阵。 就像之前做的, 使用cross_val_predict()函数进行预测, 然后调用confusion_matrix() 函数:
1 2 3 y_train_pred = cross_val_predict(sgd_clf, X_train_scaled, y_train, cv=3 ) conf_mx = confusion_matrix(y_train, y_train_pred) conf_mx
array([[5725, 3, 24, 9, 10, 49, 50, 10, 39, 4],
[ 2, 6493, 43, 25, 7, 40, 5, 10, 109, 8],
[ 51, 41, 5321, 104, 89, 26, 87, 60, 166, 13],
[ 47, 46, 141, 5342, 1, 231, 40, 50, 141, 92],
[ 19, 29, 41, 10, 5366, 9, 56, 37, 86, 189],
[ 73, 45, 36, 193, 64, 4582, 111, 30, 193, 94],
[ 29, 34, 44, 2, 42, 85, 5627, 10, 45, 0],
[ 25, 24, 74, 32, 54, 12, 6, 5787, 15, 236],
[ 52, 161, 73, 156, 10, 163, 61, 25, 5027, 123],
[ 43, 35, 26, 92, 178, 28, 2, 223, 82, 5240]])1 2 3 4 5 6 def plot_confusion_matrix (matrix ): """If you prefer color and a colorbar""" fig = plt.figure(figsize=(8 ,8 )) ax = fig.add_subplot(111 ) cax = ax.matshow(matrix) fig.colorbar(cax)
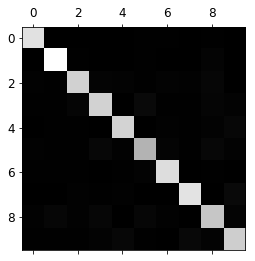
1 2 3 plt.matshow(conf_mx, cmap=plt.cm.gray) save_fig("confusion_matrix_plot" , tight_layout=False ) plt.show()
Saving figure confusion_matrix_plot
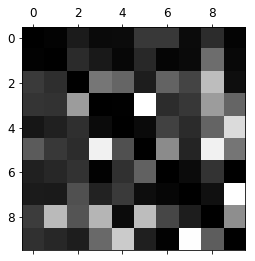
让我们把焦点放在错误上。首先,你需要将混淆矩阵中的每个值除以相应类别中的图片数量,这样你比较的就是错误率而不是错误的绝对值(后者对图片数量较多的类别不公平):
1 2 row_sums = conf_mx.sum (axis=1 , keepdims=True ) norm_conf_mx = conf_mx / row_sums
用0填充对角线,只保留错误,重新绘制结果:
1 2 3 4 np.fill_diagonal(norm_conf_mx, 0 ) plt.matshow(norm_conf_mx, cmap=plt.cm.gray) save_fig("confusion_matrix_errors_plot" , tight_layout=False ) plt.show()
Saving figure confusion_matrix_errors_plot
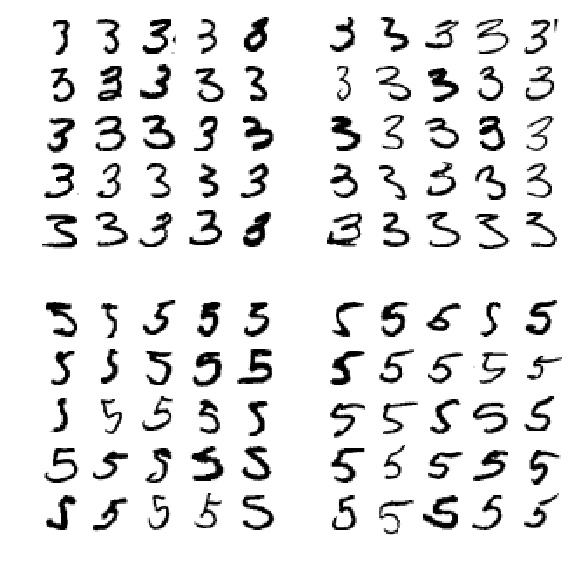
分析单个的错误也可以为分类器提供洞察: 它在做什么? 它为什
1 2 3 4 5 6 7 8 9 10 11 12 13 cl_a, cl_b = 3 , 5 X_aa = X_train[(y_train == cl_a) & (y_train_pred == cl_a)] X_ab = X_train[(y_train == cl_a) & (y_train_pred == cl_b)] X_ba = X_train[(y_train == cl_b) & (y_train_pred == cl_a)] X_bb = X_train[(y_train == cl_b) & (y_train_pred == cl_b)] plt.figure(figsize=(8 ,8 )) plt.subplot(221 ); plot_digits(X_aa[:25 ], images_per_row=5 ) plt.subplot(222 ); plot_digits(X_ab[:25 ], images_per_row=5 ) plt.subplot(223 ); plot_digits(X_ba[:25 ], images_per_row=5 ) plt.subplot(224 ); plot_digits(X_bb[:25 ], images_per_row=5 ) save_fig("error_analysis_digits_plot" ) plt.show()
Saving figure error_analysis_digits_plot图片进行预处理, 确保它们位于中心位置并且没有旋转。 这也同样有助于减少其他错误。
Multilabel classification多标签分类 到目前为止,每个实例都只会被分在一个类别里。而在某些情况下,你希望分类器为每个实例产出多个类别。例如,人脸识别的分类器:如果在一张照片里识别出多个人怎么办?当然,应该为识别出来的每个人都附上一个标签。假设分类器经过训练,已经可以识别出三张脸——爱丽丝、鲍勃和查理,那么当看到一张爱丽丝和查理的照片时,它应该输出[1, 0, 1](意思是“是爱丽丝,不是鲍勃,是查理”)这种输出多个二元标签的分类系统称为多标签分类系统。
1 2 3 4 5 6 7 8 from sklearn.neighbors import KNeighborsClassifiery_train_large = (y_train >= 7 ) y_train_odd = (y_train % 2 == 1 ) y_multilabel = np.c_[y_train_large, y_train_odd] knn_clf = KNeighborsClassifier() knn_clf.fit(X_train, y_multilabel)
这段代码会创建一个y_multilabel数组,其中包含两个数字图片的目标标签:第一个表示数字是否是大数(7、 8、 9),第二个表示是否为奇数。下一行创建一个KNeighborsClassifier实例(它支持多标签分类,不是所有的分类器都支持),然后使用多个目标数组对它进行训练。现在用它做一个预测,注意它输出的两个标签:
KNeighborsClassifier(algorithm='auto', leaf_size=30, metric='minkowski',
metric_params=None, n_jobs=1, n_neighbors=5, p=2,
weights='uniform')1 knn_clf.predict([some_digit])
array([[False, True]], dtype=bool)结果是正确的!数字5确实不大(False),为奇数(True)。
1 2 y_train_knn_pred = cross_val_predict(knn_clf, X_train, y_multilabel, cv=3 ) f1_score(y_multilabel, y_train_knn_pred, average="macro" )
0.97709078477525002这里假设了所有的标签都同等重要, 但实际可能不是这样。 特别是, 如果训练的照片里爱丽丝比鲍勃和查理要多很多, 你可能想给区分爱丽丝的分类器更高的权重。 一个简单的办法是给每个标签设置一个等于其自身支持的权重(也就是具有该目标标签的实例的数量) 。只需要在上面的代码中设置average=”weighted”即可。
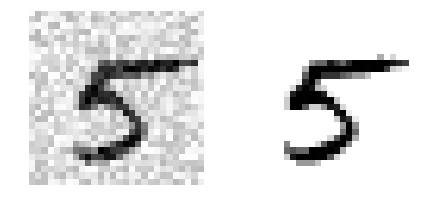
Multioutput classification多输出-多类别分类 举个例子:为了说明这一点,构建一个系统去除图片中的噪声。给它输入一张有噪声的图片,它将(希望)输出一张干净的数字图片,跟其他MNIST图片一样,以像素强度的一个数组作为呈现方式。请注意,这个分类器的输出是多个标签(一个像素点一个标签),每个标签可以有多个值(像素强度范围为0到225)。所以这是个多输出分类器系统的例子
还先从创建训练集和测试集开始,使用NumPy的randint()函数为MNIST图片的像素强度增加噪声。目标是将图片还原为原始图片:
1 2 3 4 5 6 noise = np.random.randint(0 , 100 , (len (X_train), 784 )) X_train_mod = X_train + noise noise = np.random.randint(0 , 100 , (len (X_test), 784 )) X_test_mod = X_test + noise y_train_mod = X_train y_test_mod = X_test
1 2 3 4 5 some_index = 5500 plt.subplot(121 ); plot_digit(X_test_mod[some_index]) plt.subplot(122 ); plot_digit(y_test_mod[some_index]) save_fig("noisy_digit_example_plot" ) plt.show()
Saving figure noisy_digit_example_plot
1 2 3 4 knn_clf.fit(X_train_mod, y_train_mod) clean_digit = knn_clf.predict([X_test_mod[some_index]]) plot_digit(clean_digit) save_fig("cleaned_digit_example_plot" )
Saving figure cleaned_digit_example_plot
看起来这张图片离目标足够接近了。

